Elasticsearch Data Visualization and Indexing
Implemented an end-to-end data pipeline using Elasticsearch and Kibana for indexing, querying, and visualizing structured data. Built visualizations in Google Colab using Python to analyze relationships between variables and gain actionable insights.
Step 1
Created visualizations for data analysis.
Step 1
Created visualizations for data analysis.
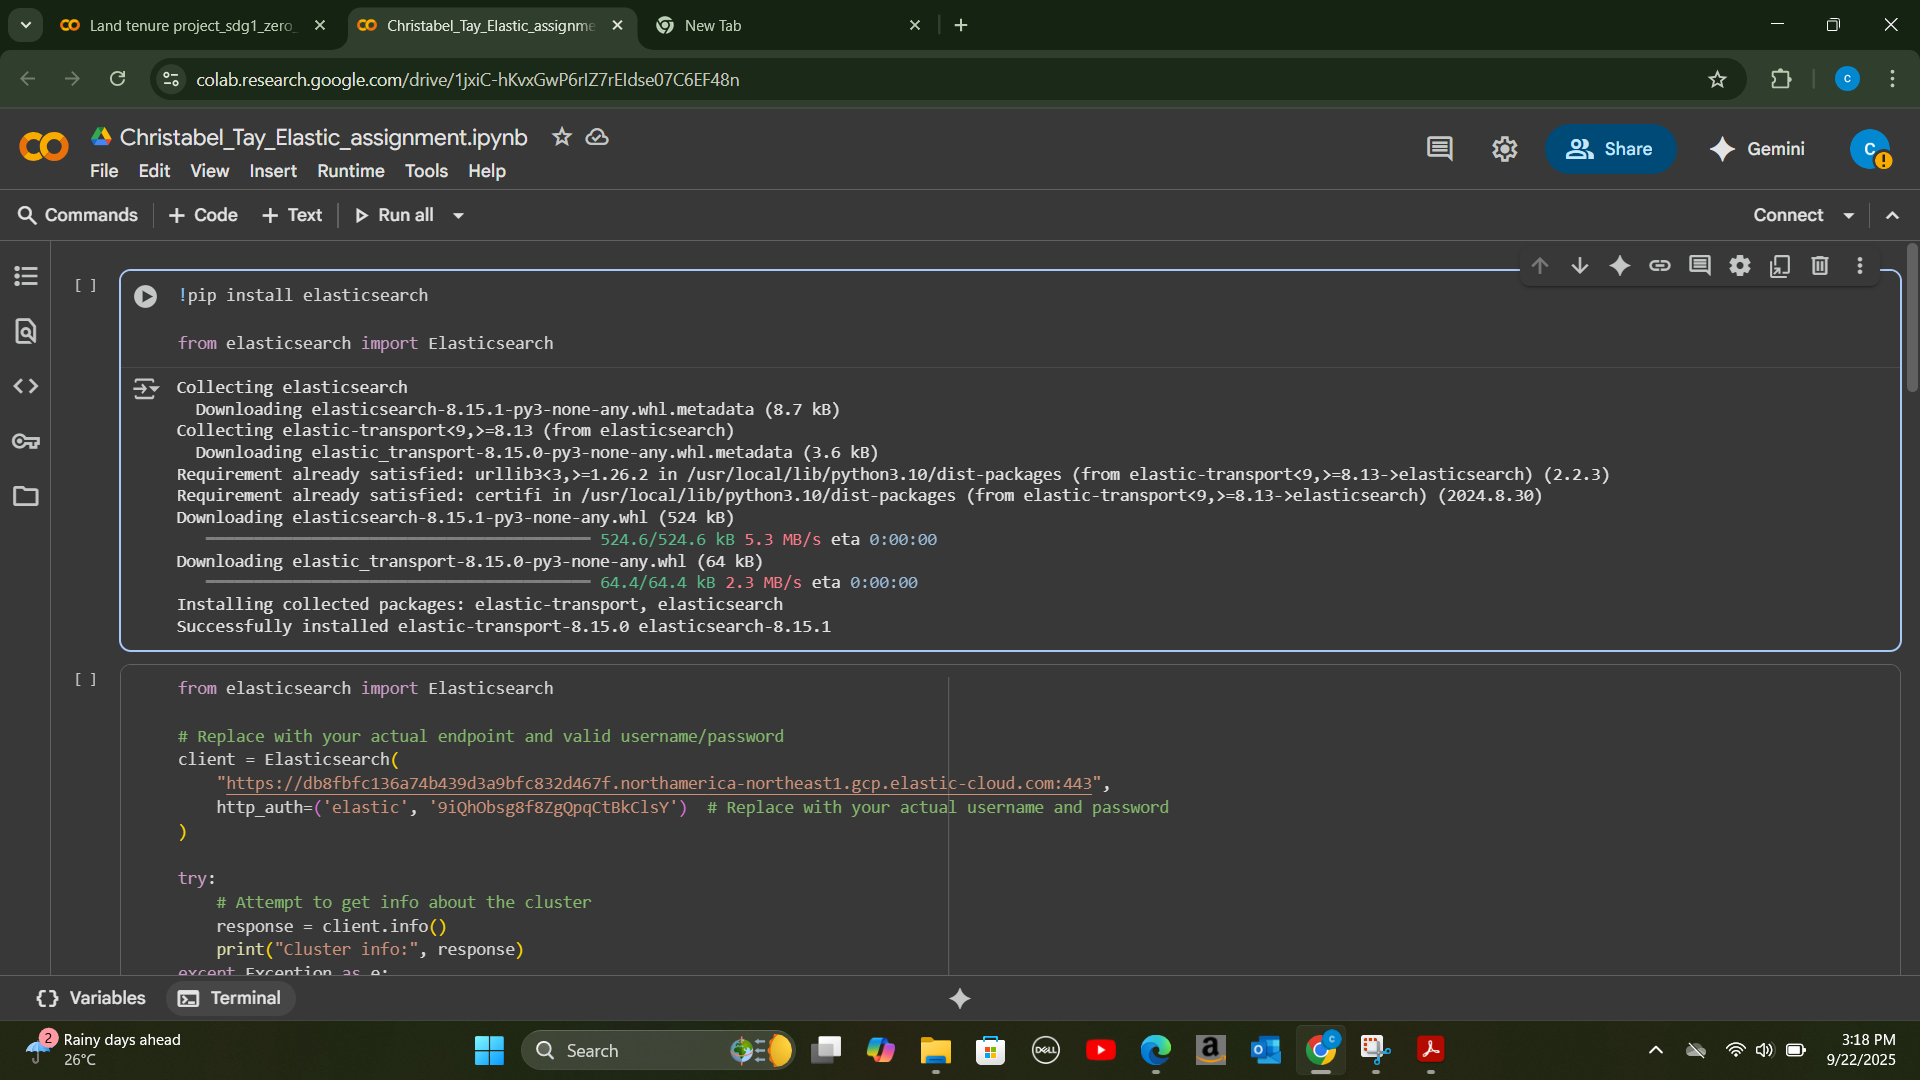
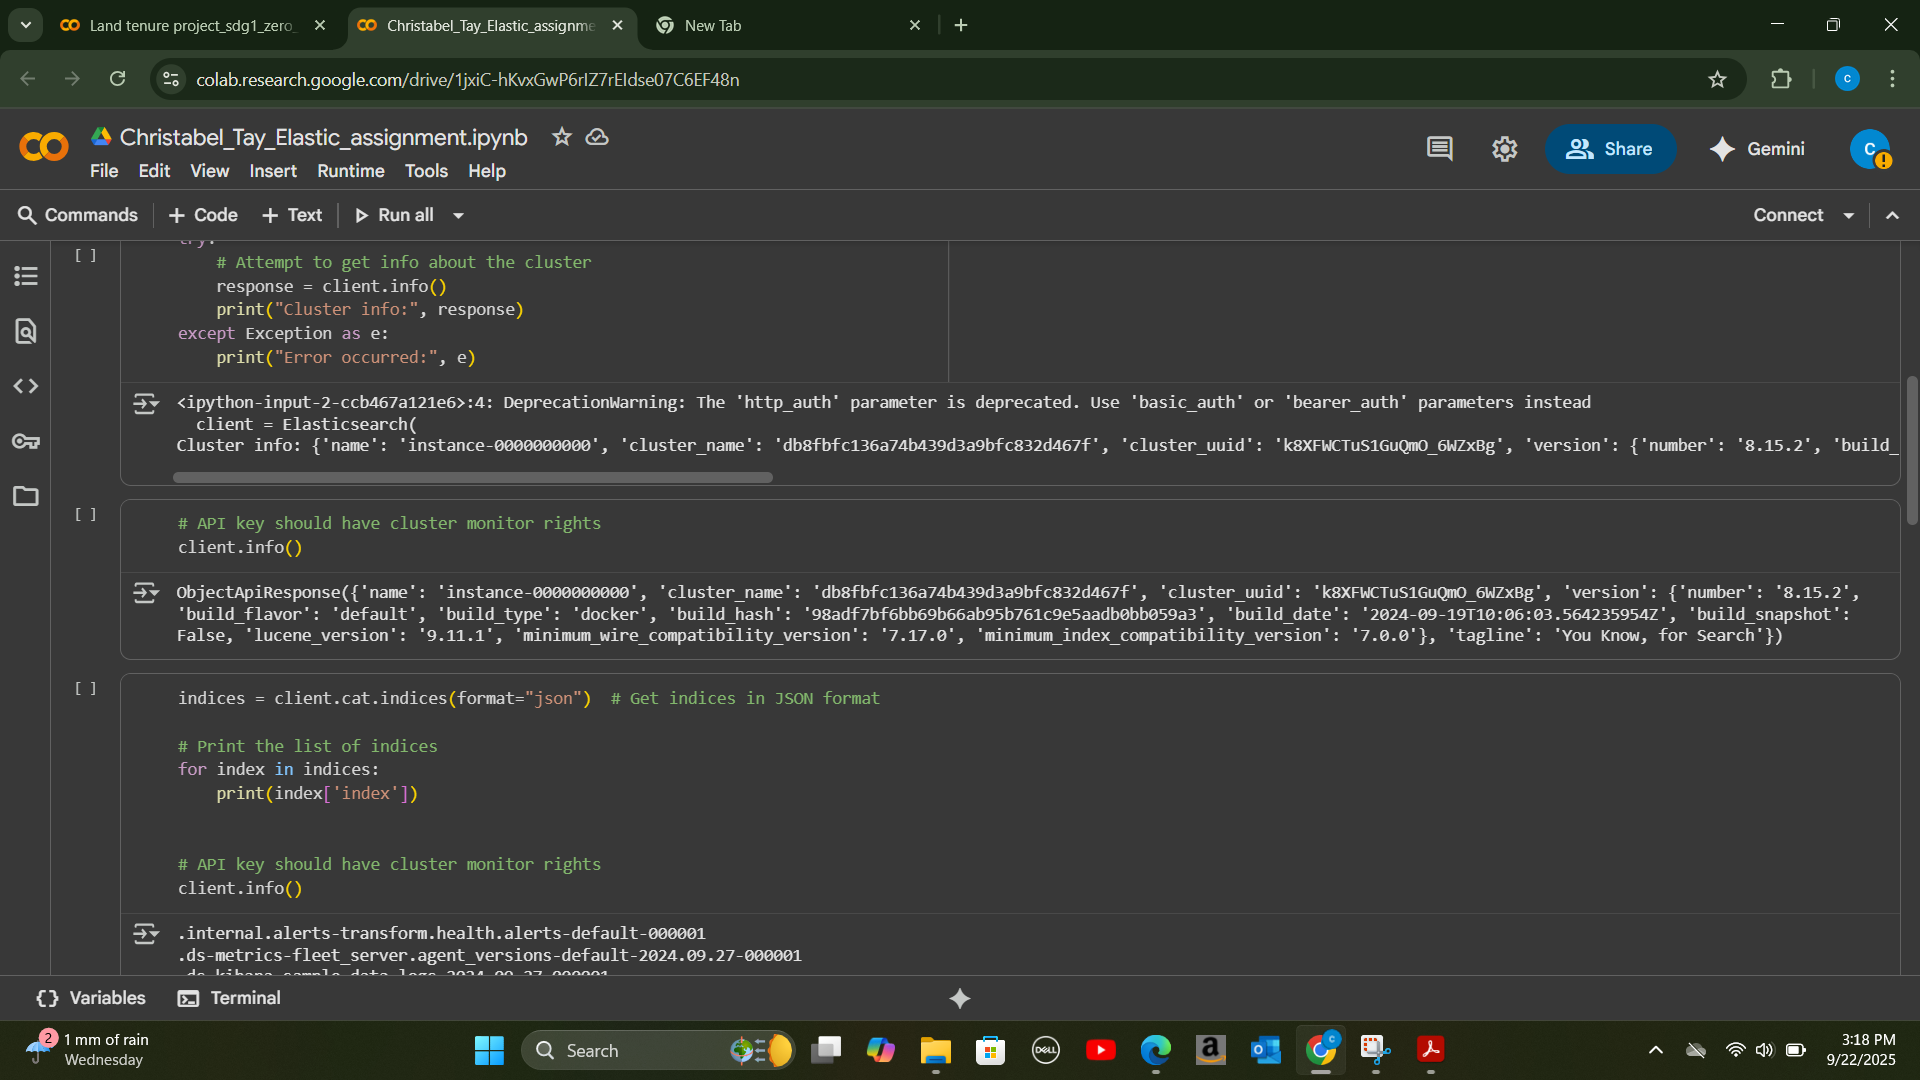
Step 2
Set up Elasticsearch indexing.
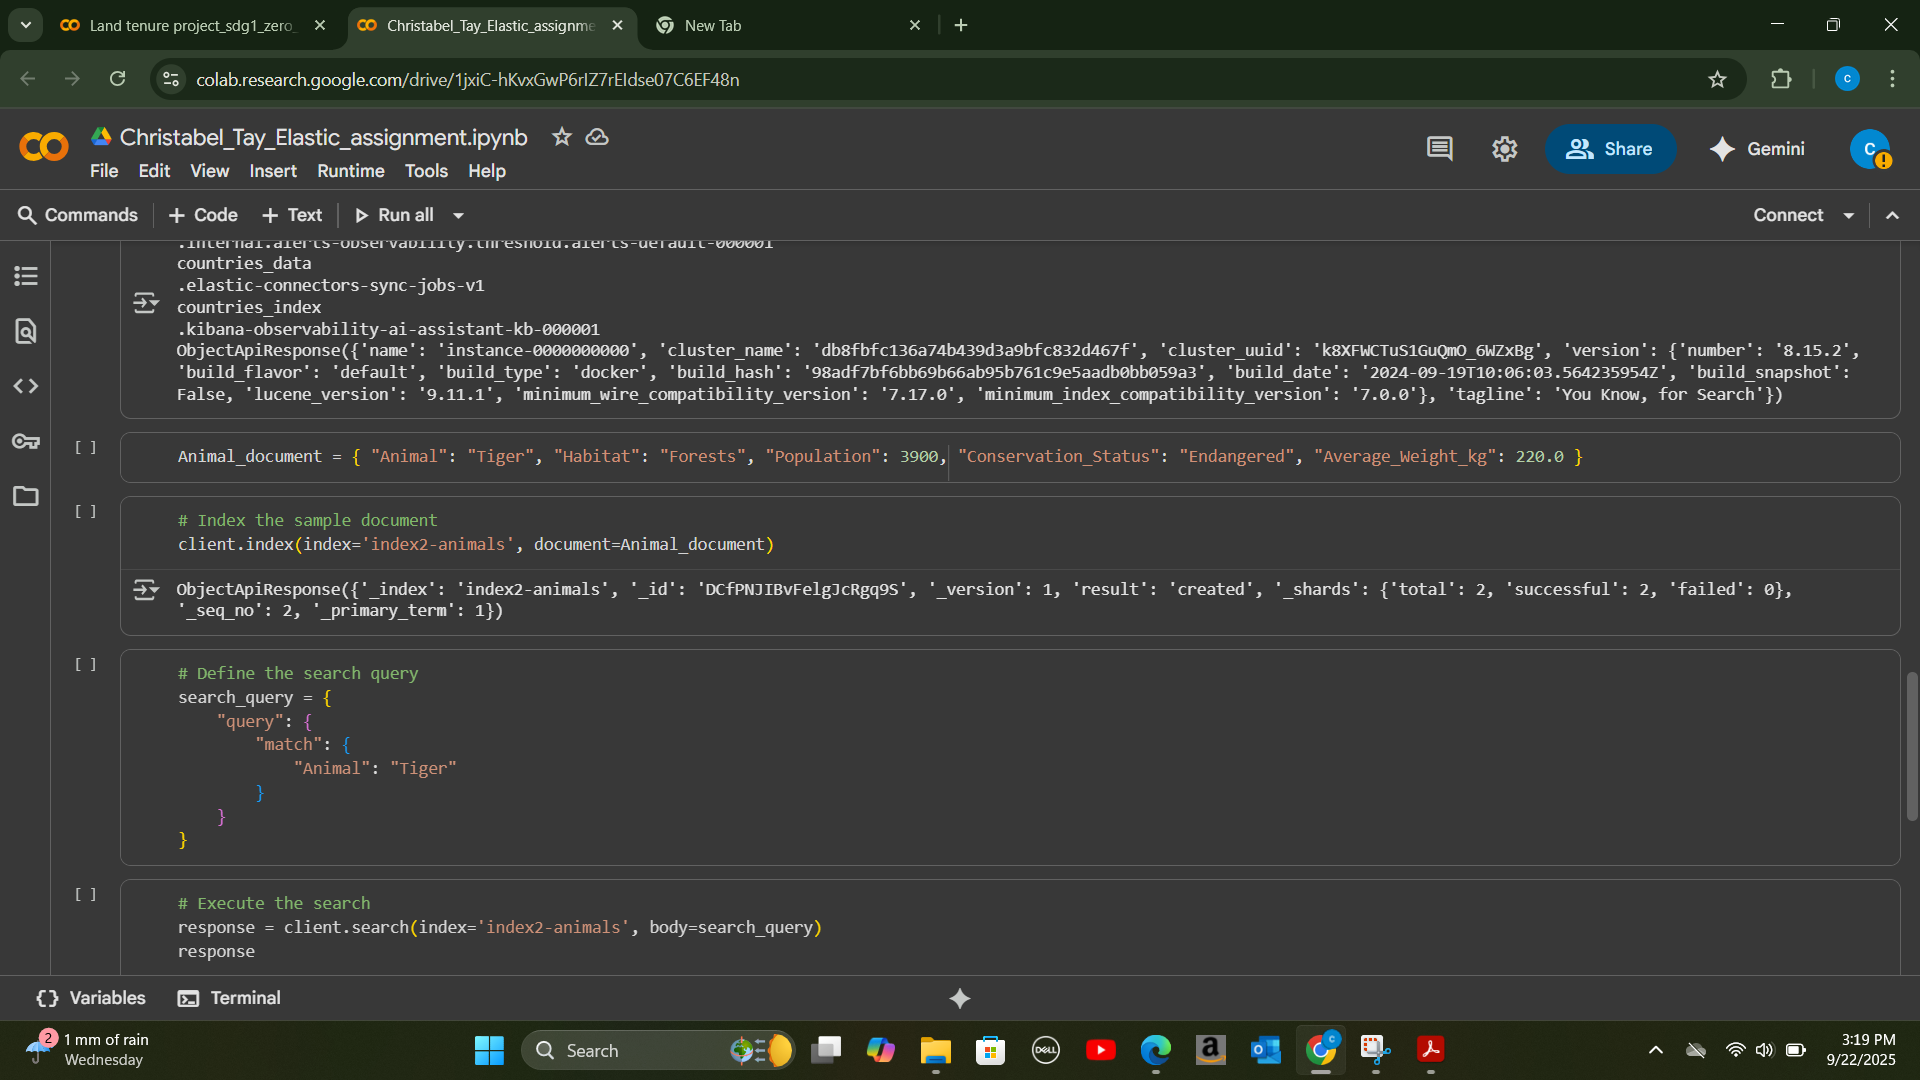
Step 3
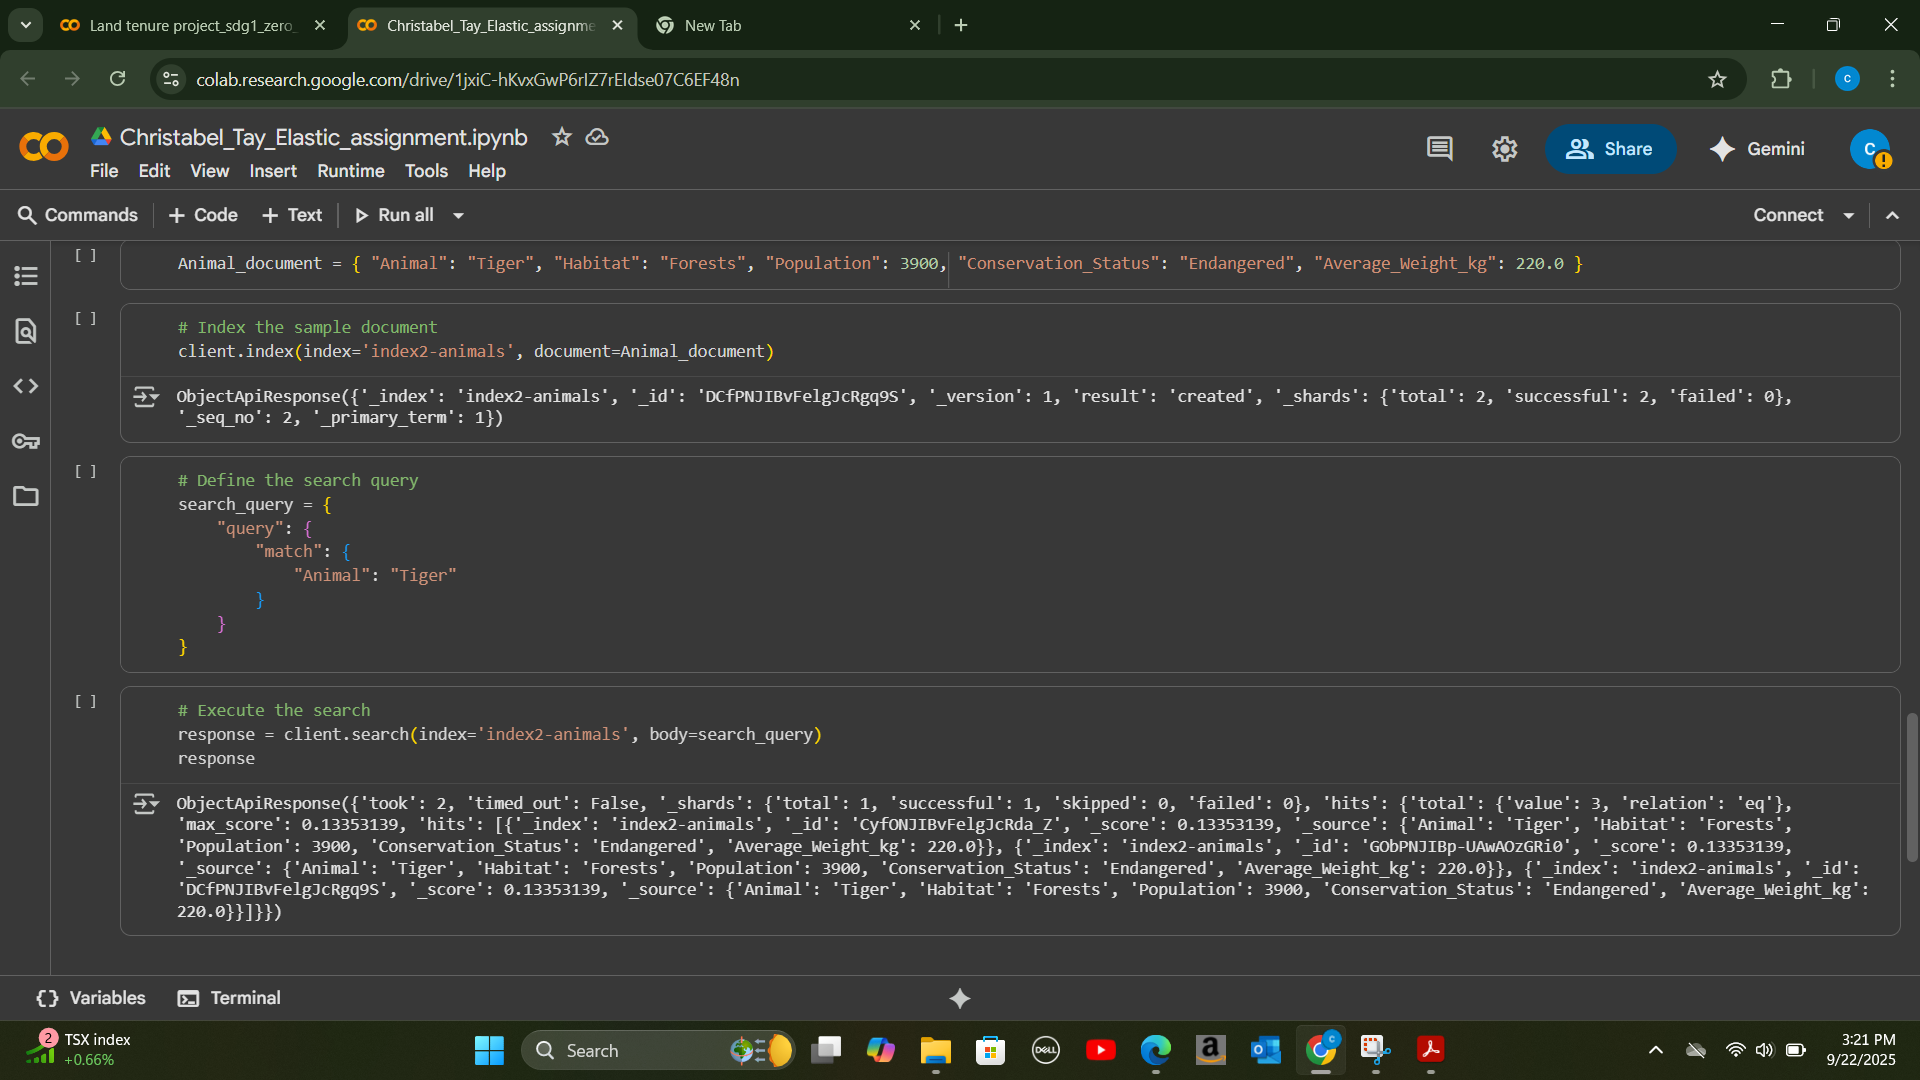
Performed real-time search and data modeling.
Steps
Step 1: Built and displayed graphs in Google Colab using Python to explore relationships between two variables and understand data trends.
Step 2: Created an Elasticsearch client and a new index (`index2-animals`), ingested structured documents, and executed search queries to retrieve relevant records.
Step 3: Applied real-time search capabilities, structured the data model for effective retrieval, and interpreted the output for actionable insights.
Step 4: Connected Elasticsearch data to Kibana and built interactive dashboards for monitoring and analysis.
Tools
Elasticsearch, Kibana, Google Colab, Python
Frameworks
Search and Analytics, Data Modeling, Real-Time Monitoring
Standards
ISO 27001 (A.12.4 – Logging and Monitoring), Data Analytics Best Practices